Category: Power BI

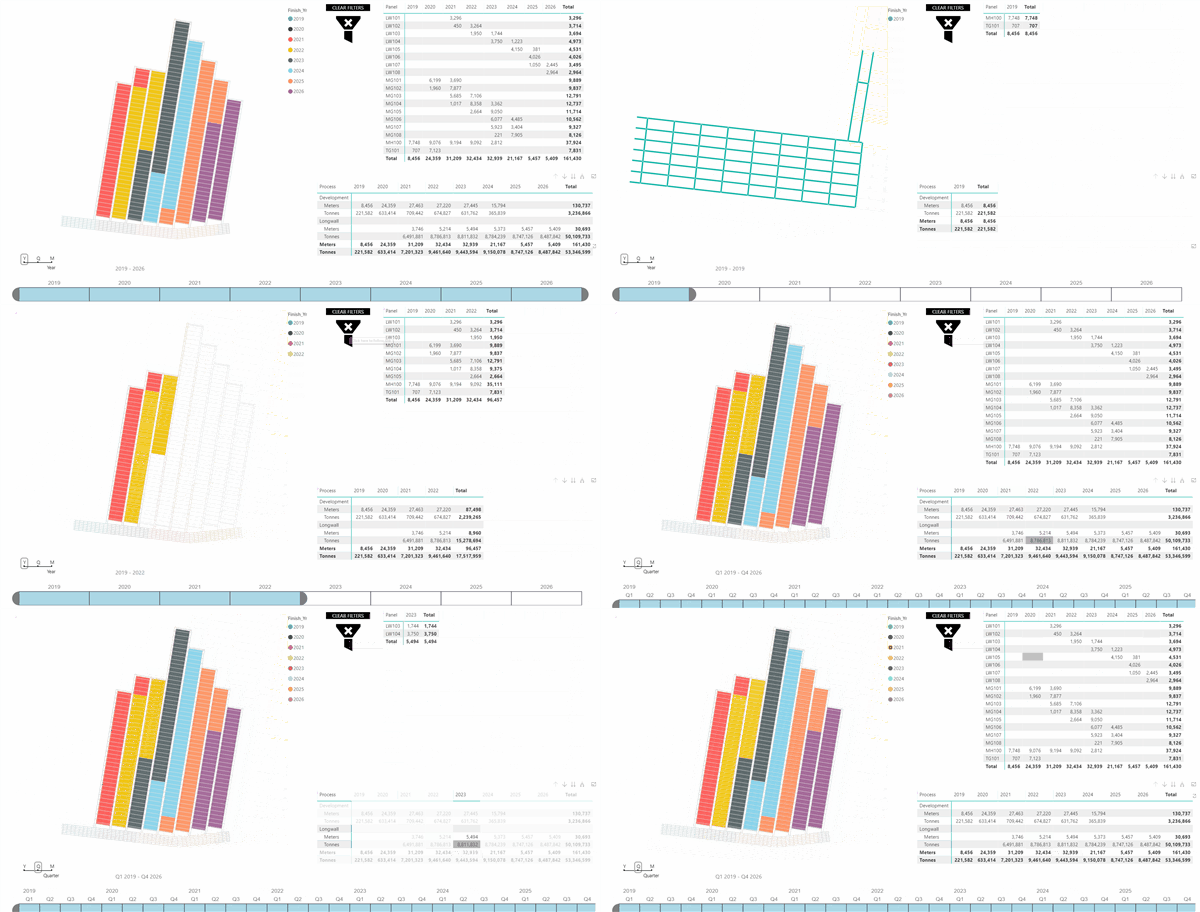
Interactive Mine Plan in Power BI

Mine sites all over the world are currently implementing dashboards to display their data. Power Bi has proven to be very easy to use and cost-effective and is often chosen as the software to build these dashboard. It is now possible to show and interact with CAD mine plans in Power BI. The examples below…
Read more

26/02/2019 0

U.S. Energy Use Flow Charts

Based on an interesting discussion on a visualisation of the US Energy Consumption in Sankey format, I decided to replicate the chart below into an interactive version to see the change of the energy mix over several years.’ The LLNL Energy Flow Chart is created each year by the Lawrence Livermore National Laboratory. Note: some…
Read more


30/05/2018 0

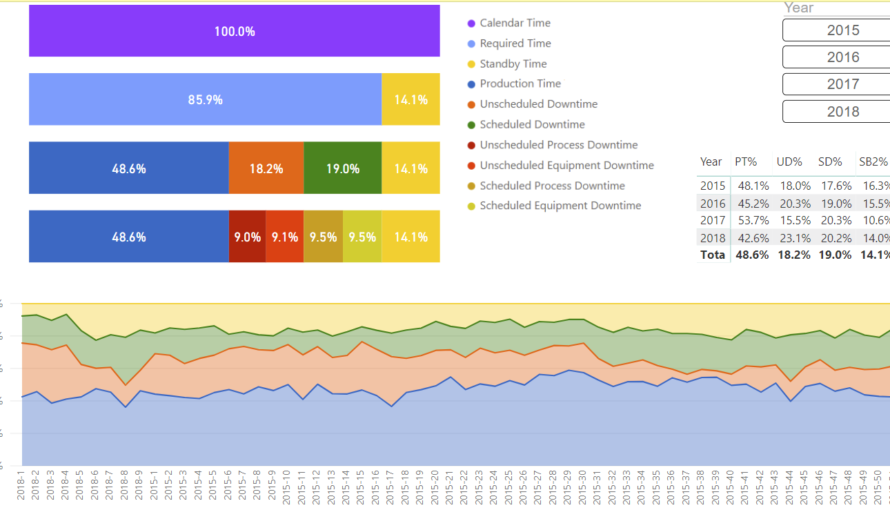
Interactive Time Usage Model in Power BI

During a recent productivity analysis job for an operating underground mine 2JS Mining was able to convert their production delay data into a Time Usage Model (or TUM) format that they were more familiar with. A Time Usage Model is simply a way of splitting production time or delays into different codes so these can be…
Read more


13/03/2018 0